RaspberryPi and Docker Monitoring
Introduction¤
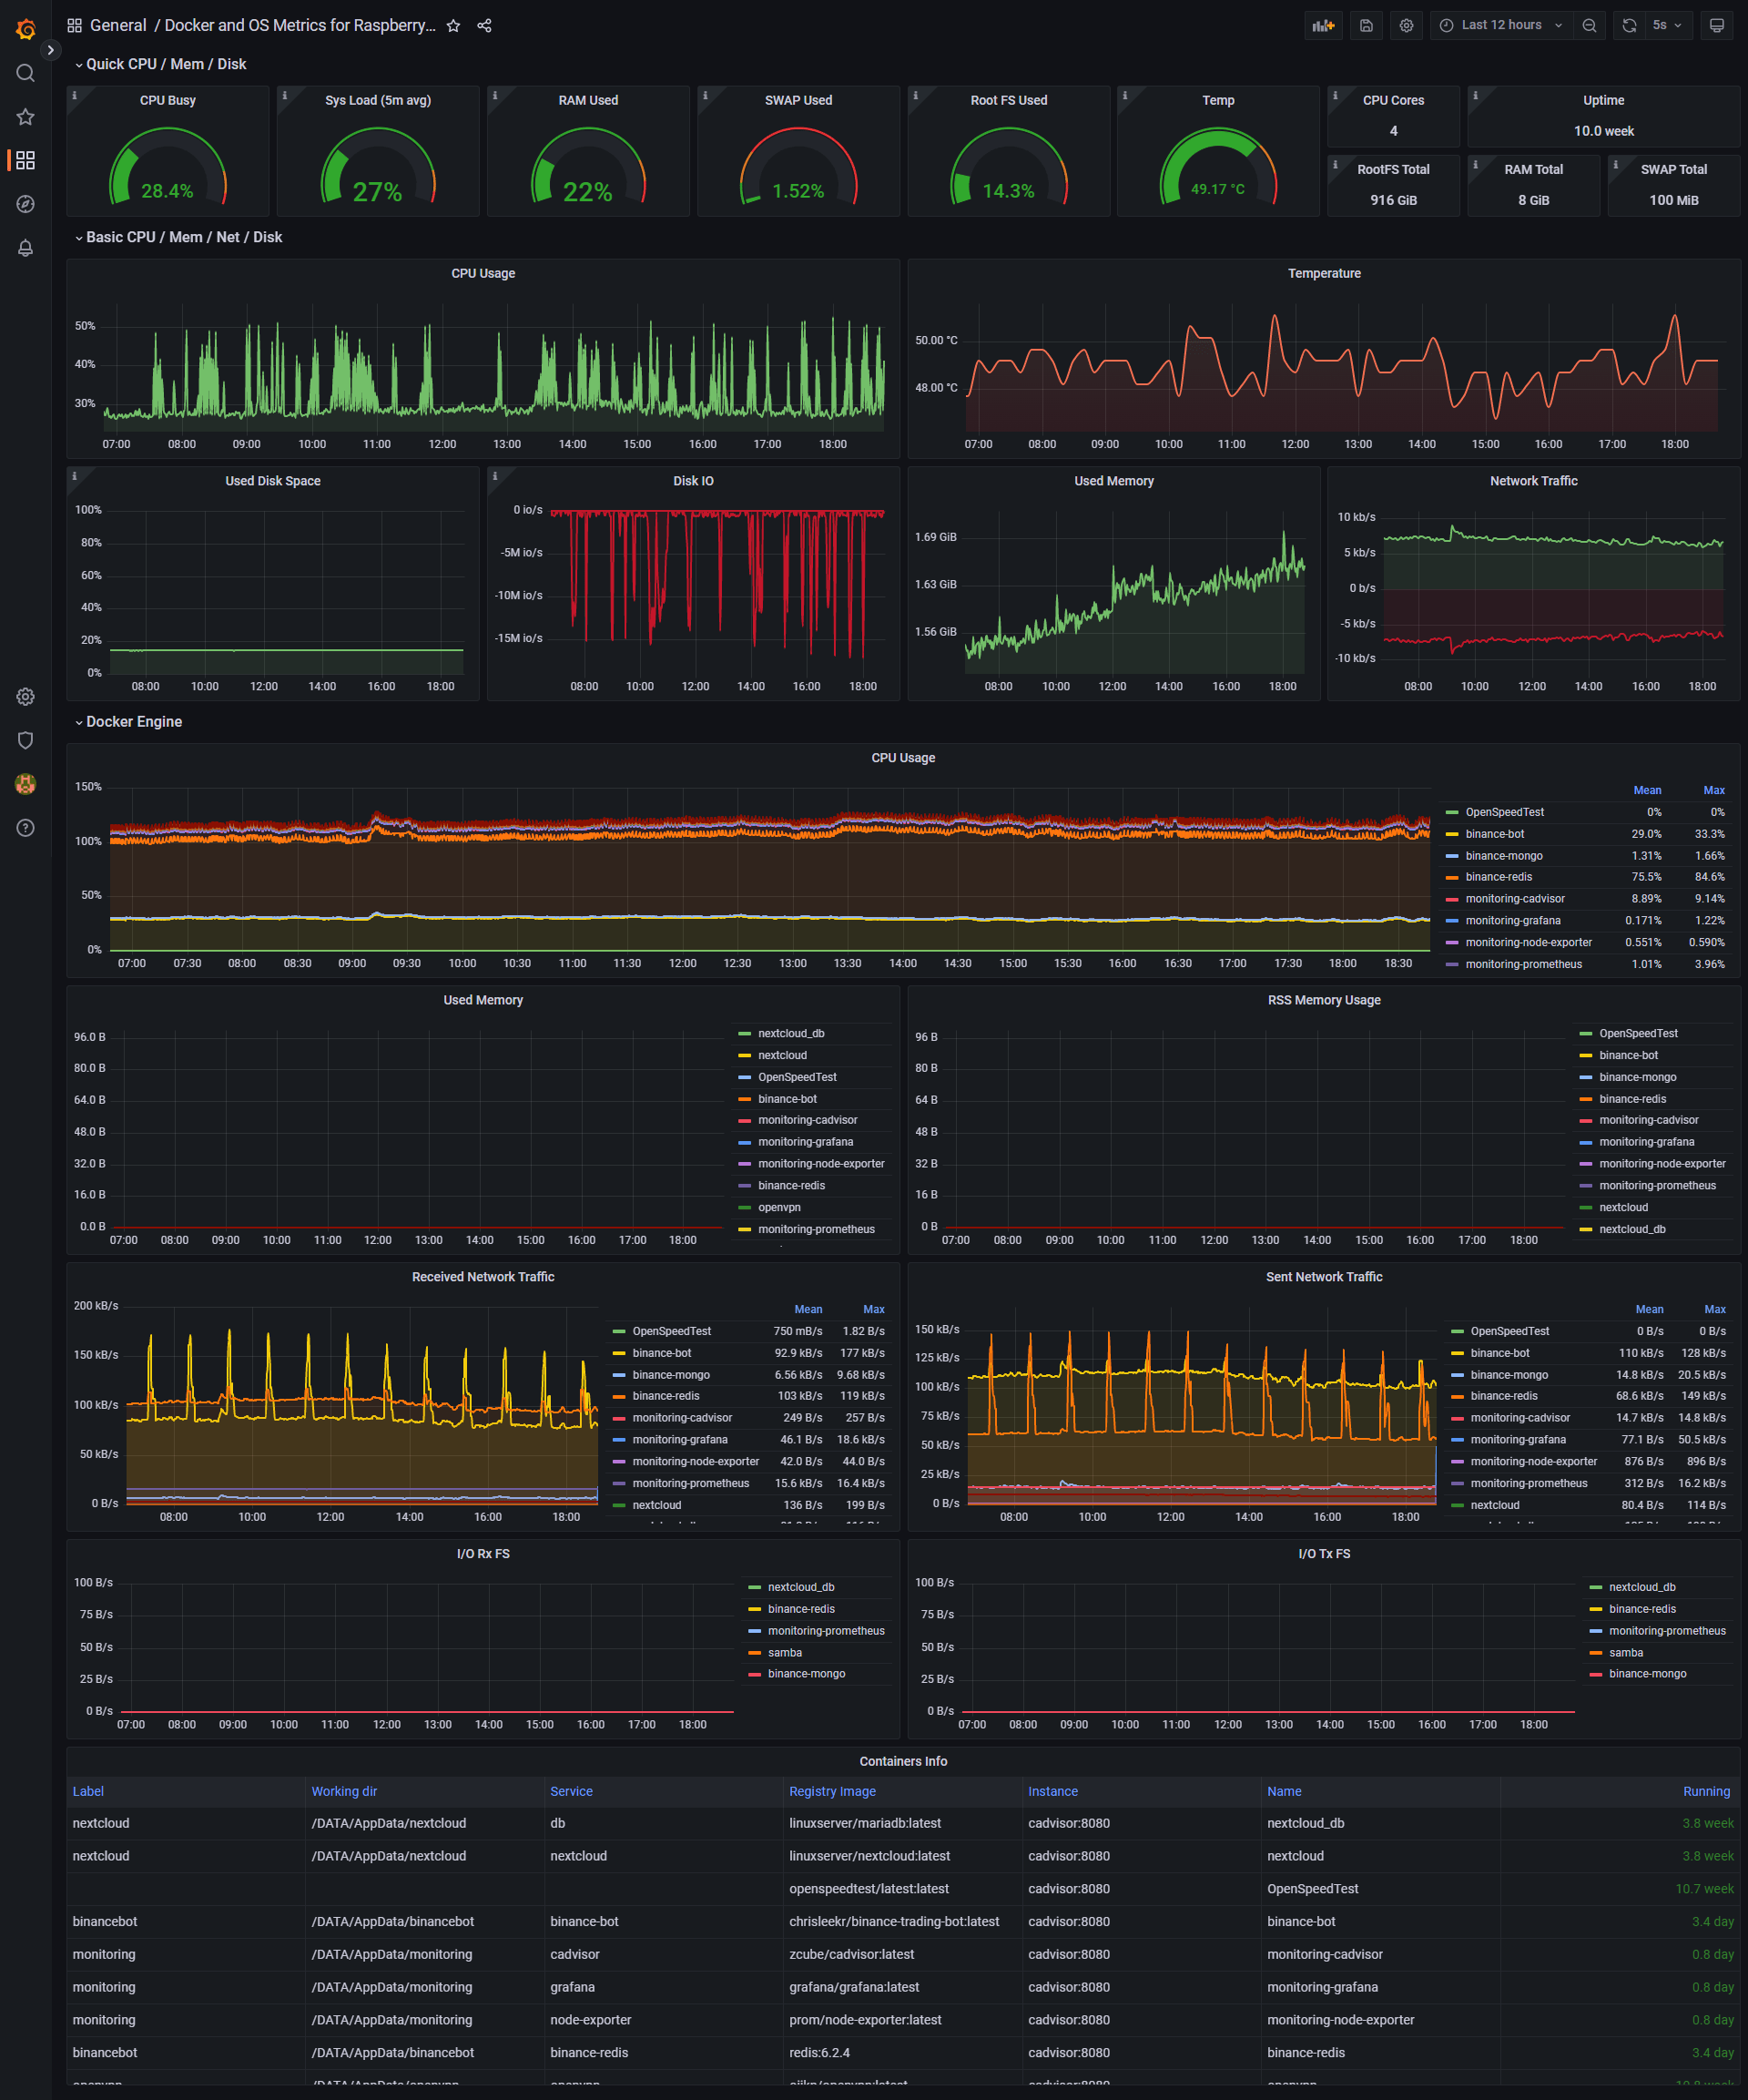
The Raspberry Pi monitoring solution using Grafana, Prometheus, Cadvisor, and Node-Exporter Stack! This project aims to provide a comprehensive and user-friendly way to monitor the performance of your Raspberry Pi. With Grafana's intuitive dashboards, you can easily visualize system metrics collected by Prometheus and Cadvisor, while Node-Exporter provides valuable information about the Raspberry Pi's hardware and operating system. The combination of these tools results in a powerful and efficient monitoring solution that will give you complete visibility into your system's health. Check out the project and take your Raspberry Pi monitoring to the next level !
This repository contains a docker-compose file to run a Raspberry PI monitoring stack. It is based on the following projects:
- Prometheus
- Grafana
- cAdvisor
- NodeExporter
Prerequisites¤
Before we get started installing the stack, we need to make sure that the following prerequisites are met: - Docker is installed on the host machine - Docker Compose is installed on the host machine - The host machine is running a Raspberry PI OS or any other compatible Linux distribution
Installation and Configuration¤
To install the stack, follow the steps below:
-
Clone this repository to your host machine.
git clone https://github.com/oijkn/Docker-Raspberry-PI-Monitoring.git -
Enter to the cloned directory.
cd Docker-Raspberry-PI-Monitoring -
Create
datadirectory and change the ownership of theprometheusandgrafanafolders for a nice and clean installation.mkdir -p prometheus/data grafana/data && \ sudo chown -R 472:472 grafana/ && \ sudo chown -R 65534:65534 prometheus/ -
Start the stack with
docker-compose.docker-compose up -d
This will start all the containers and make them available on the host machine.
The following ports are used (only Grafana is exposed on the host machine):
- 3000: Grafana
- 9090: Prometheus
- 8080: cAdvisor
- 9100: NodeExporter
The Grafana dashboard can be accessed by navigating to http://<host-ip>:3000 in your browser for example http://192.168.1.100:3000.
The default username and password are both admin. You will be prompted to change the password on the first login.
Credentials can be changed by editing the .env file.
If you would like to change which targets should be monitored, you can edit the prometheus.yml file.
The targets section contains a list of all the targets that should be monitored by Prometheus.
The names defined in the job_name section are used to identify the targets in Grafana.
The static_configs section contains the IP addresses of the targets that should be monitored. Actually, they are sourced from the service names defined in the docker-compose.yml file.
If you think that the scrape_interval value is too aggressive, you can change it to a more suitable value.
In order to check if the stack is running correctly, you can run the following command:
docker-compose ps
View the logs of a specific container by running the following command:
docker logs -f <container-name>
Add Data Sources and Dashboards¤
Since Grafana v5 has introduced the concept of provisioning, it is possible to automatically add data sources and dashboards to Grafana.
This is done by placing the datasources and dashboards directories in the grafana/provisioning folder. The files in these directories are automatically loaded by Grafana on startup.
If you like to add a new dashboard, simply place the JSON file in the grafana/provisioning/dashboards directory, and it will be automatically loaded next time Grafana is started.
Install Dashboard from Grafana.com (Optional)¤
If you would like to install this dashboard from Grafana.com, simply follow the steps below:
- Navigate to the dashboard on Grafana.com Dashboard
- Click on the Copy ID to Clipboard button
- Navigate to the Import page in Grafana
- Paste the ID into the Import via grafana.com field
- Click on the Load button
- Click on the Import button
Or you can follow the steps described in the Grafana Documentation.
This dashboard is intended to help you get started with monitoring your Raspberry PI devices.